
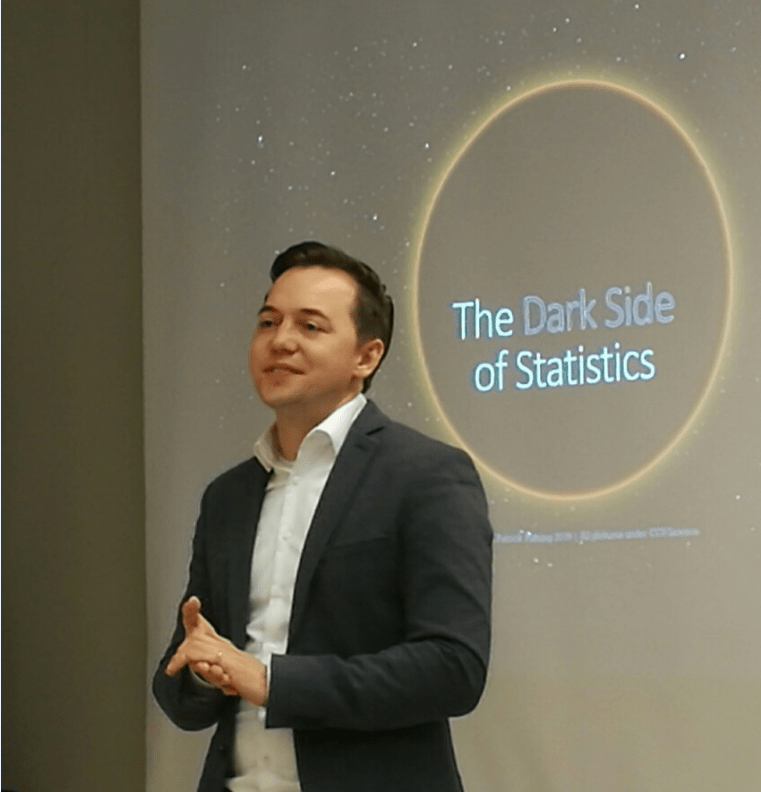
“The dark side of statistics may become a trap, if the subject is not used professionally. Among the current wide use of data analytics and popularization of statistical tools, we need to know more about statistics and understand it deeper. It will help to avoid its dark side”, believes Prof. Dr. Patrick Planing from Stuttgart Hochschule für Technik, a partner University of Metropolia. He shared his views with the students of Master’s program in Business Informatics in a guest visit to Metropolia University of Applied Sciences.
Traps of Statistics Typical of Media: Miscalculations
Statistics has gained a lot of credibility is society over the years. Readers of newspapers and popular journals are used to reading unusual, sometimes shocking news, and get easily convinced as soon as statistics is mentioned. In practice, however, a sloppy use of statics can lead to even fake news, when the concussions are drawn superficially, but positioned as if based on careful statistical analysis.
Consider this claim:
“The proportion of suicides in all deaths is highest among the people under 20 years with 25%, compared with 10% among 30-40 year olds, and less that 2% among over 70 year olds”.
Conclusion (wrong):
“So, the decision to commit a suicide decreases more and more with the age”.
Can we agree with this claim? If we look at it closer, there are many flows in this claim. First, there are no absolute numbers, which makes it unknown how many actually died in every age group. As a result, the current proportion cannot be correct since the death numbers in each groups are different. Also, there are no reasons indicated for the other deaths (they may be due to traffic accidents, diseases, etc), which makes the picture distorted, as there may be a growing number of other reasons for death in older age groups.
If such news are published in press, they look scientific, but the public should not be deceived. If we read this claim slowly, think of the context, and consider if this is possible at all, we can see that it cannot be correct, and does not allow to judge reliably about the behaviors of different age groups.
More Traps for Media: Misinterpretations
There are many of such false news. One very famous example originated from a study conducted by Denmark, universities, that investigated which students complete and which drop their studies. The drop rate was up to 40% over the first year, so it was important to explore the reasons for this. The research group discovered a surprising and rather confusing result. They found a negative correlation between the drop rates and the drinking habits of students. But it was not the conclusions that comes immediately to mind (that drinking habits lead to drop outs), but the opposite. The surprise was that the regularly drinking students dropped less!
All world media shared these unbelievable news: the more you drink, the more successful you are in your studies! “Sober students are more likely to drop off” were the headings in many media. But could we really draw such a conclusion form this statistical study? No, we cannot.
First of all, this cannot be a conclusion but a hypothesis, as there may be other variables interfering into this correlation. In other words, it is not that “X correlates with Y”, but “X correlates with Z (a third variable), which correlates with Y”, and other variables may be missing from the analysis. For example, social occasions may contribute to completing the studies. Maybe, it is the active social life that helps success in the studies (the students, who did well, and did not drop, did not fear the exam, probably because they socialized with others). Since this statistical study did not look deeper into the habits, we just do not know. As statistics professionals know, correlation does not indicate any causality. In other words, the most likely explanation may not be the truth. True reasons may be many. A simple answer is to check carefully before making claims.
Traps of Statistics for Professional Science: In Significance Level and Data Openness
However, even the correct process of interpreting the data can lead to wrong results that are seemingly based on correct statistics. If we look beyond popular media, there are still many underlying reasons (not only the fake news) why statistics can be “lying with the numbers”. It may happens, for example, if someone is trying to make sense of statistics – in any science, in biology, chemistry, economy etc. – without awareness of specific flaws that may be awaiting.
One of the reasons of flawed results in science, especially in the past, is the way how we do science. It often dictates wrong conclusions.
The current statistical rates of measuring the acceptability of science results started in 1925, with the British statistician Ronald Fisher offered a cup of tea with milk to his colleague, Muriel Bristol. Muriel refused this cup saying that Fisher poured tea first and milk second into her cup, while she likes it the other way round. She also claimed that she can see it at a glance which liquid was poured first. Fisher arrange a special experiment for her, to check how many times she could correctly make such a prediction. Fisher concluded that ”Bristol divined correctly more than enough of those cups into which tea had been poured first to prove her case”.
But how many cups are enough? Since Fisher’s influential 125 books, the statistical significance was accepted at the rate of 5% for scientific results to prove “true”. In 1925, Fisher’s believed that 6-8 cups were “well enough” (starting from Fisher’s statistical book), and since then a significance rate of 5% has been accepted by science as “well enough” for many disciplines, and often continues till now.
In practice, however, statistical significance does is not equal to a real life significance. If we have a significantly large size of sample, even the smallest effect can be calculated as a significant result!
By now, enough evidence is collected by statistics that argue against a blind adoption of the 5% significance level (and this is still the rate to get published in medicine, for example!) reliable results cannot be obtained. In 1925 it was probably ok, but it cannot be accepted any more, although it still happens today. If someone tests a new drug against 5% significance level, it simply does not make sense, as the significance level alone does not tell us anything about the effect of the drug.. This is clear to all who know statistics and its behavior.
This is where “bad science” comes from that has come into light in recent years. The answer is to have a significant difference, and do not accept low levels with 5% of proof. This is not any more acceptable and there is a lot of discussion around it nowadays.
How to Avoid These Traps in Science and Business?
Therefore, good science needs to have, first of all, to pay attention to the significance levels and the size of the sample group. Next, good science will also absolutely necessary analyze the difference, measuring the true effect size. Good science should check all the factors carefully, by testing the same correlation in random groups, the bigger the groups, the better the ground! At the same time, professional scientists cannot rely only on correlation. The problem with correlation is that is does not say anything, it does not prove any causality. This is why there is a need to establish experiments. A good reading here is the book “Designing experiment” Fisher, 1943.
My message to students is do not be fooled by media or “poor” science who do not understand the dark side of statistics. Also, for professional scientists, it is important to stop use “null” hypothesis tests, or testing the opposite instead of testing the actual phenomena. Such “null” tests lead to a lot of confusion (like in patient statistics developed in 19th century, instead of using significance testing). But the main issue for science is the absolute necessity to publish the data (instead of a 5-page note about conclusions, which can be drawn incorrectly). Give the raw data, show it, tell how much and what was measured; or if not publish, demonstrate the data to experts, similar to the practice in referenced journals. This initiative is called “Open data initiative”, there still could be flawed data, but this openness about the simple will increase reliability of science results.
Management of organizations should also be aware of these effects. Management needs more educations in order to use the statistics produced by consultants and own staff more effectively. This is especially evident for Marketing research. There was a big discussion in “Spiegel” magazine recently, and some professionals even claim that all marketing research is flowed since consultants are not educated in statistical methods. This discussion shows that deeper knowledge of statistical methods is needed for professional in all fields, journalists, politicians, even scientists. A wide society also need to be more demanding and create pressure to prove the grounds for conclusions based on statistics. Without a careful check of the utilized data samples, the data analysis process and interpretation, no reliable conclusions are possible, even from such a precise discipline as statistics.
=================================================
Prof. Dr. Patrick Planing – a guest speaker from Stuttgart Hochschule für Technik teaching Statistics and Statistics Models for big data. His interested include business psychology, future thinking, predictions, strategy scenarios, and many other interesting topics related to data.
Zinaida Grabovskaia, PhL – a lecturer and Head of Business Informatics Master’s Program at Metropolia University of Applied Sciences. Zinaida is interested in inviting the latest and most important topics to professional discussion with Metropolia Master’s students.


Kommentit
Ei kommentteja