
Avainsana: Business Informatics Master’s Program
Designing for Sustainability in Berlin. A master´s study trip to “International Week on Sustainability 2022”
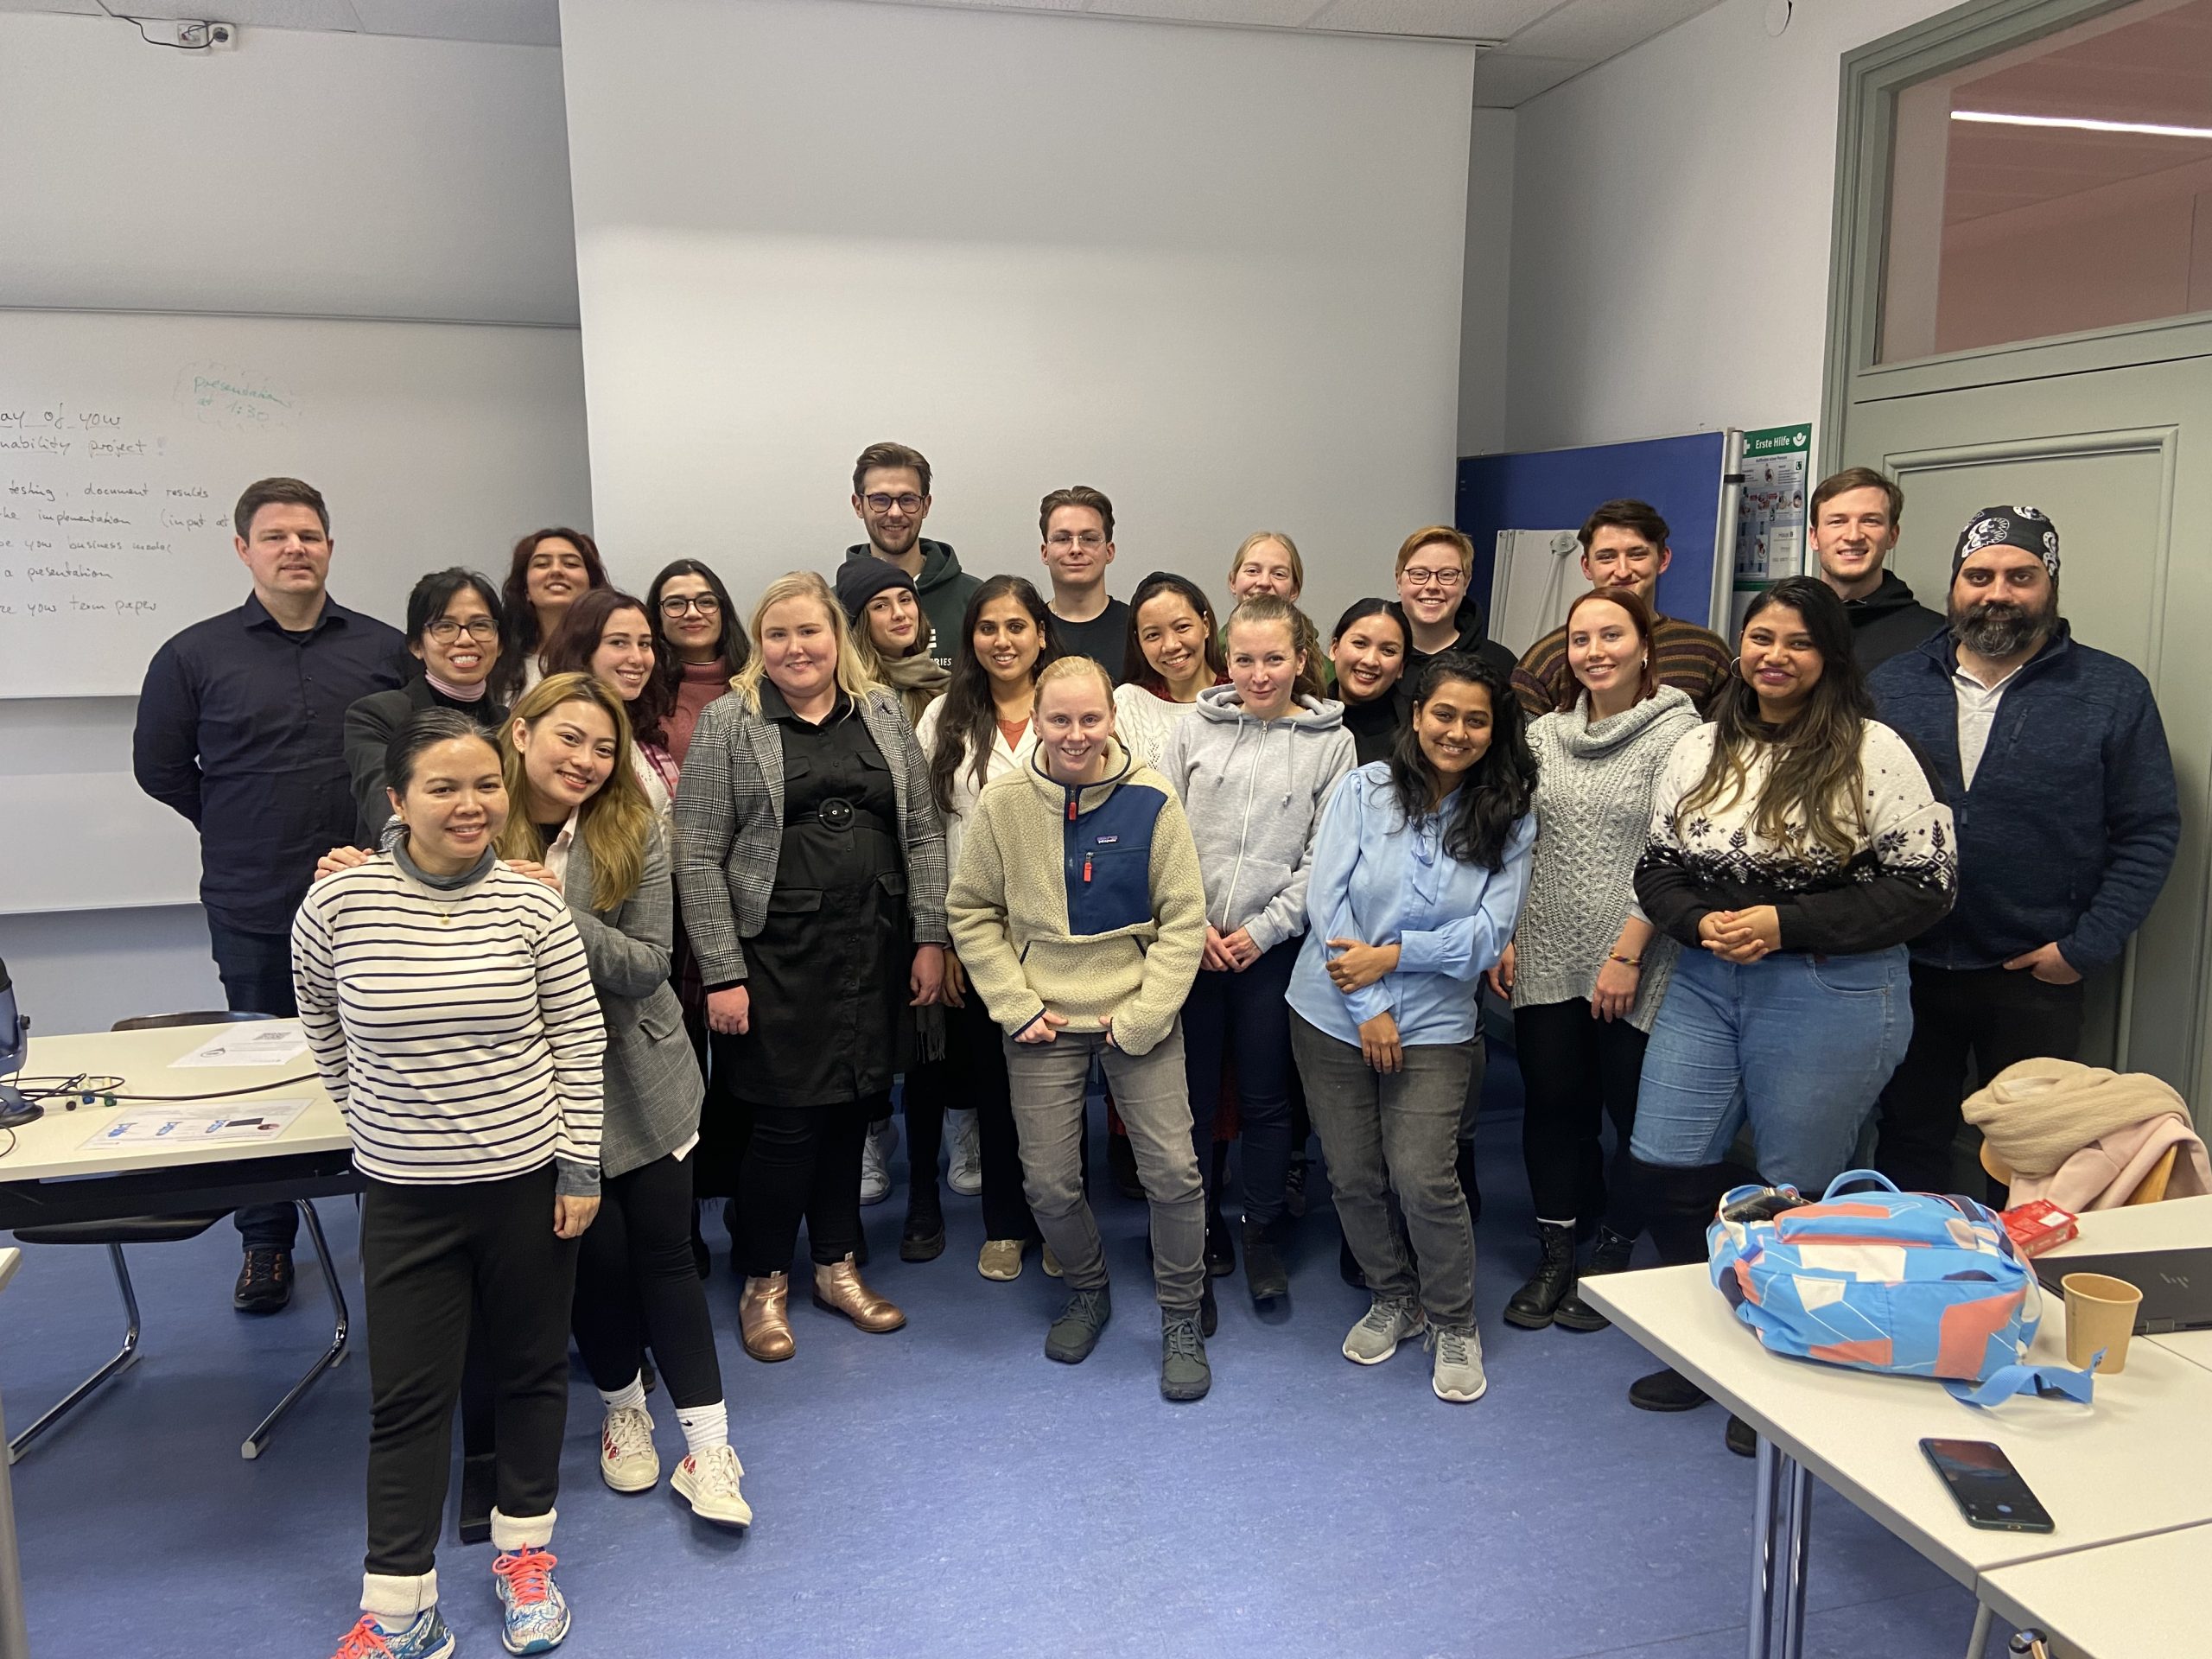
The Berlin School of Economics and Law (1) organizes the annual International Week on Sustainability (IWS) since 2019 with the goal is to integrate sustainability into the higher education curriculum. This year 2022, HWR invited master’s students from Metropolia for the second time to participate in the design and development of sustainable solutions together with companies and students from other countries in a series of workshops that lasted for 4 days, 18-21 November 2022. Our group of 10 master´s students was excited to get an approval from Meropolia´s International office. Additionally, the IWS study trip offered a chance to earn 3ECTS while solving real-world sustainability concerns, so we longed to go and try. The final argument in favor of the trip was its destination, as Berlin represents significant historical legacy, making it a unique opportunity to visit and experience it, difficult to pass by. Fast forward to November, it felt surreal to land at Berlin airport, and we were too excited to feel exhausted. Even the rain, slushy streets, and chilly air could not dim our spirits. In Berlin, we were all determined to expand our knowledge and make new connections. Day 1. Opening Day and Kick-off The program kick-off took place in HWR Startup Incubator Space located in the Siemens industrial park. It started with a briefing with project partners from Startup Incubator Berlin, which featured the startups in the sustainability field. The introduction also included a brief review of Service Design methods and tools covered by Prof. Christian Klang of HWR. There were about 30 participants coming from different academic and business fields who were assigned to five working teams. Each team selected one of the following challenges: 1) incentivizing nature-based solutions to climate change; 2) making travel sustainable and meaningful; 3) incentivizing CO2 reduction during commute; and 4) communicating vegan food delivery effectively. Teams put their hands to work on the challenge they had selected. The startups sat down with the teams to explain their projects and share their motivations and visions. Ideas poured in as each team concentrated on solving the issues and gathering data. Day 1 came to a close with more questions than answers. Day 2 and 3. Ideation and Prototyping Day 2 sessions were held on the HWR campus (2). As we had grown accustomed to the modern design of Metropolia´s campuses, the large corridors, arched hallways, and marble floors in the HWR campus were a little surprising. Teams worked seriously to build and test their prototypes. It became obvious that cooperation is essential to the success of the projects and this is where online tools for team collaboration became critically useful. Ideas and information were together put in an online board to make sure that good ideas and critical pieces of information are not missed out. The challenge was to make business sense out of all the ideas and information that we had, as we quickly realized that bright ideas and passion were necessary but not enough. We kept reminding ourselves that we needed to find solutions that would be viable, feasible, doable, and would make business sense for our partner startup. The second day ended with coffee and laughter, as we watched the first snowfall of the year covering HWR. On Day 3, we went to The Morp Company, a consulting firm that offers sustainability advice. A brief workshop on the use of the business model canvas as a tool to address corporate sustainability concerns was held and received very well as a hands-on new tool. Day 4. Pitch for Impact Day 4 was a pitching day. As teams presented their ideas and answered questions from partner startups and other participants, it was inspiring to see the variety of proposed solutions. There were no earthshaking proposals, but the teams focused on concepts that made real business sense and would advance true sustainability. Although the solution reports still need to be finalized, we felt a sense of accomplishment for having done something worthwhile as the last session ended. Discovering Berlin In all honesty, finding our way to the session locations in the morning was a bit challenging. Because of this, coffee and Google Maps have become our close allies. When in Berlin, we didn’t just snap pictures. We needed to get out there, interact, and connect. Berlin is blissful for shoppers and vibrant for foodies and art lovers. A frequent conversation starter during this trip was “Is this your first time in Berlin?” It was easy to say “Yes” in response to this question. “How do you find Berlin?” and “Which sites have you visited?” were the typical follow-up queries. With each passing day, we would find ourselves giving different answers because Berlin is too diverse to describe in a few words. Despite our time constraints due to working 4 full days on projects, we were nevertheless able to visit some famous sites. We were lucky to witness the start of Berlin's Christmas market and were able to sample local food including currywurst, kebab, stollen cake, and local wine. We had our taste of misadventure too during the first attempt to visit the Brandenburg gate, as we ended up at a factory site due to our over-reliance on Google Maps. On the last day of the trip, it was difficult to bid Berlin goodbye. Armed with new knowledge and filled with the brilliant sparks of Berlin, we boarded our plane to return to Finland. References The Berlin School of Economics and Law (Hochschule für Wirtschaft und Recht, HWR, Berlin) is one of the largest universities of applied sciences in Berlin. It was founded in 2009 as a result of merged of two other big higher education institutions, and it now enjoys more than 150 partners around the globe, including Metropolia UAS, its long-time partner. Read more about HWR from its web-pages: https://www.hwr-berlin.de/en/ Berlin School of Economics and Law, Badensche Str. 52, 10825 Berlin. The picture below shows the marble floors and grand interiors of this campus. About the author Karen Espiritu is a 1st year MBA student in Business Informatics at Metropolia Business School. Karen is a certified project manager and a result-driven professional who is passionate about fostering organizational sustainability on all three fronts: economic, social, and environmental. She enjoys blogging in her spare time and is an active student ambassador of Metropolia. Her video about IWS-2022 in Berlin can be found here: https://www.youtube.com/watch?v=DPiUds0fVvo
Creating a Roadmap to Digital Transformation: A strategic plan to overcome the barriers to digital acceleration

Today, the digital opportunities are evolving faster than the pace of transformation in the organizations. To better understand the path our business is on, where to focus the efforts, and how to overcome the disruption and resistance to change, I decided to use this challenge as a topic for my Master´s thesis and created a roadmap for accelerating the digital transformation towards achieving my company’s future state (1). In the course of this research and development project, I realized several important things which I want to share with the readers. What is Digital Transformation? Many companies often end up with misunderstanding the concept of digital transformation. They often do not differentiate between beliefs and realities about digital transformation. Instead, before embarking on a digital transformation journey, companies need to become aware of a wide professional discussion going on in the professional world and be aware of key findings that business practitioners have came up with based on the experience of industry leaders. I summarize these key points below: First, digital transformation is not just about implementing new technology. It is about the adoption of digital technology to improve business processes, value for customers and innovation. (2) Second, digital transformation is not just a buzzword for business but a way to grow. Therefore, it requires clear targets for each source of value creation and ensuring that the entire company shares one digital vision. Third, digital transformation is not optional, it is mandatory for business success. It helps company businesses gain a competitive advantage. (3) Last, digital transformation is often mistaken for digitization or digitalization, but there are some significant differences. Digitization is, according to Wikipedia (4), the process of converting information into digital. Digitalization is, as Gartner (5) defines it, the use of digital technologies to change a business model and provide revenue and new value opportunities. While digital transformation is about transforming the customer experience and changing how to operate and deliver value to customers. What does acceleration of digital transformation mean? For most of digital services companies, the COVID-19 crisis has had an “all-or-nothing effect” on their digital strategy agenda. As reported by Deloitte (6), 77% of CEOs considered that the pandemic had sped up their company’s digital transformation plans. The crisis has significantly accelerated the digitization in terms of way of working and do business. Many businesses have already embraced transformational change. However, this large scale change should be fast. To leverage the opportunities quicker and overcome the possible challenges faster than the competitors, you don’t have to rush to the corner shop to buy the smartest gadgets. Instead, your company will need to start enhancing systematically your organization culture, operations, and capabilities for the workforce of the future. This phenomenon is called acceleration of digital transformation. McKinsey (7) suggests that the “digital first movers and fast followers capture more value within their industries than slower-moving companies”, taking the lead on digital transformation. It is just what Klaus Schwab, Executive Chairman of the World Economic Forum, said about the impact of speed on the business level: “In the new world, it is not anymore so much about the big fish which eats the small fish, it’s the fast fish which eats the slow fish.” What are the key enablers of digital transformation? The digital transformation is a journey where the desired destination and the path are different for every company. Like on any journey, a careful planning and a well-organized process would help the company to reach the destination safely and avoid back-roads and unnecessary costs. An analysis of the digital maturity of a digital services company, using BCG’s Digital Acceleration Index (8), reviled three relevant domains impacting its journey to successful digital transformation. First, the operations optimization needs a systematic digital approach in decision making to improve the quality of work and ensure customer satisfaction. Second, the digital talent is needed to enhance the changes to digital transformation to succeed points to building capabilities for the workforce of the future. Third, the dynamic organization that lies in creating an agile culture and new ways of working. As the figure below shows, the enablers for accelerating the digital transformation include precisely these three elements: the optimized operations, engaged digital talent & leaders, and dynamic organization. In other words, the chances for a successful digital transformation will be greatly increased in case your organization is able of doing: quick decision making, building the digital capabilities for the workforce of the future, rolling out an agile culture, and establishing new ways of working. What is a digital transformation roadmap and why do we need it? Most importantly, making your organization succeed in the digital transformation needs a plan with clear steps and effective actions to achieve the goals as part of your growth strategy. Mapping out these steps on a timeline with clear milestones builds a digital transformation roadmap. The roadmap that I proposed in my thesis for accelerating the digital transformation of my company that provides digital services defines three major elements to reach the digital transformation acceleration: 1) implementing a systematic approach in decision making, 2) building digital capabilities for the workforce of the future, and 3) creating an agile culture and a new way of working. By doing all of these, the company can better deliver relevant business outcomes to customers with fast payback and also enhance employee performance. On an EndNote Industry leaders often want to understand how far they are on the road of digital transformation. This was also the case with my organization that is concerned with the same question. After completing my investigation, my conclusion is this. Your organization is a digital transformation “performer” if (a) it has started to adopt the new ways of working, (b) has taken the efforts to build a more agile culture, (c) it has developed new digital capabilities, (d) it has a leadership mindset, and (e) it has streamlined the operations across its teams and organization. About the author Violeta Tudose is a seasoned professional with a MSc in Computer Science and many years of industry experience. Currently, Violeta is a Huld Leader at Huld ltd. Recently, Violeta decided to take up yet another challenge and graduated as Master of Business Administration from the Master’s programme in Business Informatics. Welcome to contact Violeta via violeta.tudose@huld.io and her LinkedIn. References: (1) Tudose, V. (2022). Roadmap to Digital Transformation. Master´s Thesis. Metropolia University of Applied Sciences. Available from: https://www.theseus.fi/handle/10024/783038 (2) Shaban, H. (2022). Digital Transformation Process: 5 Factors That Can Empower Your Transformation Strategy: Blog. Apti.io (18 February 2022). Available from: https://www.apty.io/blog/digital-transformation-process (3) Chakravarty, V., Wang, J, and Ahuja, S. (2021). Why digital transformation doesn’t have to be hard. (Online publication). Available from: https://www.ey.com/en_ph/board-matters/why-digital-transformation-doesnt-have-to-be-hard (4) Digitalization. Wikipedia (Definition). Available from: https://en.wikipedia.org/wiki/Digitization (Assessed 24 November 2022). (5) Digitalization. Gartner Glossary (definition). Available from: https://www.gartner.com/en/information-technology/glossary/digitalization (6) Kane, G.C., Phillips, A. N., Copulsky, J., and Nanda, R. (2020). Digital Transformation through the lens of COVID-2019: A case of acute disruption. Deloitte Insights. Availabe from: https://www2.deloitte.com/us/en/insights/topics/digital-transformation/digital-transformation-COVID-19.html (7) Booth, A., De Jong, E., Peters, P. (2018). Accelerating digital transformations: A playbook for utilities. McKinsey. Available from: https://www.mckinsey.com/~/media/mckinsey/business%20functions/mckinsey%20digital/our%20insights/accelerating%20digital%20transformations%20a%20playbook%20for%20utilities/accelerating-digital-transformation_a-playbook-for-utilities-vf.pdf?shouldIndex=false (8) Boston Consulting Group, BCG (2020). Accelerating digital to build the ´bionic company´: BCG´s Digital Acceleation Index (DAI) to more digital maturity. Digital BCG. Available from: https://cdn.auckland.ac.nz/assets/auckland/business/our-research/docs/CODE/Accelerating%20digital%20to%20build%20the%20'bionic%20company'%20Framework%20and%20case%20study.pdf
Corporate Ride-Sharing: Yet another promising option in sharing economy

Technology creates possibilities for organisations, and one of the well-known existing problems of commuting can be solved by integrating and promoting a ridesharing application within corporations. A ridesharing service refers to any method of transportation in which commuters use a single vehicle, either a private or company vehicle, to reach a similar destination. So far, ridesharing is known through initiatives such as Uber, Lyft, Taxify, Gett, Juno, and smaller providers around the world. It has its advantages and limitations, as with any initiative in the sharing economy. In this blog, a corporate ride-share service is described that was proposed as a student´s thesis project for the Aviapolis area, Vantaa, an area popular with companies and corporations. History of Ride Sharing The earliest reports of ridesharing arise in early 20th century America. The consent found between 1914 -1918, known as the Jitney craze (1), allowed individuals to think of an innovative and effective way to use their vehicles. With mass-produced cars flooding the market and the early stages of a recession coming into play, enterprising car owners in 1914 began offering rides in their vehicles for a “jitney” – five-cent streetcar fare. The idea grew from Los Angeles across America in less than 12 months, with an estimated 1,400 jitneys operating in San Francisco alone. Ride Sharing As economic growth increased, mobility became more important to support human activities and needs. One of the most prevalent needs is transportation to and from work. Long commutes cost employees and their companies considerable time, wasted resources, productivity, and additional expenses (emotional, physical, financial). New, fast-growing business regions located away from city centers are especially affected by this. In Helsinki, one such example is the Aviapolis business district (2), which is currently transforming into a business hub. More than 37,000 people are employed by more than 1,000 companies in the area. The area, however, faces its challenges with complicated commuter traffic and a congested parking lot, and main roads are highly congested during business hours. Corporate Ride Sharing The goal of this Master's thesis was to present an application for corporate ridesharing as a possible solution to this problem. In this thesis, we describe a solution to a common need: traveling between two locations. Some areas lack frequent public transportation, which means that the time interval between transport is very high or varies — resulting in long waiting hours, long traveling time, and higher costs. Corporate Ridesharing is one of the most valuable solutions when there are no other means of transportation to a specific location. The new service was outlined based on extensive analysis of the customer needs of the employees at several companies in the Aviapolis area. It was followed by the development of the actual application based on the PiggyBaggy platform. PiggyBaggy is another excellent example of how innovations help the world run better (3). The thesis combined web technology into a ridesharing solution to help provide immediate economic, environmental, and social benefits to the companies and their employees in the Aviapolis region. The application developed in the Master´s thesis was launched successfully(4), providing an easy platform to the employees of participating companies. There were also two pilots done in 2020-2021. Turku Pilot We have commenced a pilot where the objective is to create an incentive for drivers to offer rides in their car by giving in return access to parking places in prime locations in the city center . Additionally, we are testing in a particular area whether a combination of community services in addition to ride-sharing would increase participation. Tampere Pilot In this case, it was a public hospital, and the parking place management was again taken care of by a local operator. The participant numbers were encouraging, and the employer (hospital) issuing the parking place incentive is keen on considering scaling up the trial in the Fall. Results: Users in PSHP-group: 56 Rides executed: 232 Rides per month: 123 Because the trials were limited in duration, we did not reach the targets for shared-ride numbers as planned. However, I strongly believe that we planted the seed for Ridesharing and its benefits among many employees, which I believe will grow over time. The service is being improved by integrating AI-based trip and transport mode detection to automatically create routes for offering or requesting rides, as well as integrating with MaaS services (make transport capacity visible, e.g., in Matkahuolto Reitit ja Liput). About the Author Usman Khanzada earned his Master's degree in Business Informatics from Metropolia UAS. Professionally working as a Client Integration Manager for In4mo Solera. His career trajectory is based on Client management, process improvement, and project management in the information technology and services industry. He is passionate about finding ways to reduce CO2 in the corporate sector by taking the right steps and addressing the issues essential to the future health and well-being of employees, the community, and the planet. References Ride Share Research. (2009, 24 January). Massachusetts Institute of technology, Rideshare History & Statistics. MIT “Real-Time” Rideshare Research. [Online] Available at: http://ridesharechoices.scripts.mit.edu/home/histstats/ [Accessed June 2021] City Vantaa (2022). Aviapolis Major Region. Available at: https://www.vantaa.fi/en/regions-and-districts/aviapolis-major-region [Accessed November 2022] Piggy Baggy. (2021). KCity Market. K-citymarket Lahti Paavola hypermarket. [Online] Available at: https://pages.piggybaggy.com/en/partners/ [Accessed June 2021]. Usman, K. (2021). Corporate Ridesharing Application for Aviapolis Business Region. Metropolia University of Applied Sciences: Master´s Thesis [Online] Available at: https://www.theseus.fi/handle/10024/501460
The Dark Side of Statistics
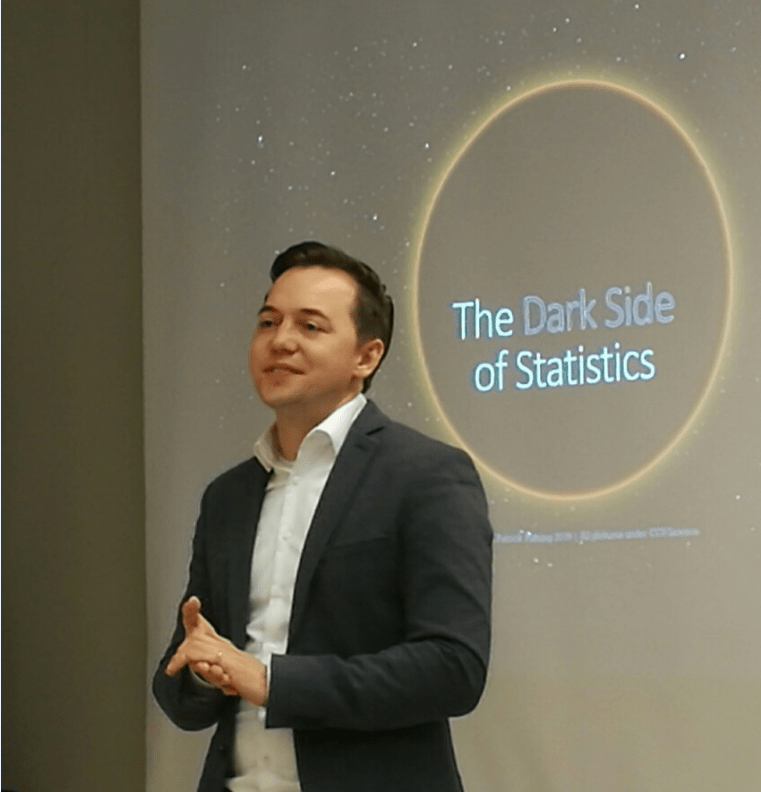
“The dark side of statistics may become a trap, if the subject is not used professionally. Among the current wide use of data analytics and popularization of statistical tools, we need to know more about statistics and understand it deeper. It will help to avoid its dark side”, believes Prof. Dr. Patrick Planing from Stuttgart Hochschule für Technik, a partner University of Metropolia. He shared his views with the students of Master’s program in Business Informatics in a guest visit to Metropolia University of Applied Sciences. Traps of Statistics Typical of Media: Miscalculations Statistics has gained a lot of credibility is society over the years. Readers of newspapers and popular journals are used to reading unusual, sometimes shocking news, and get easily convinced as soon as statistics is mentioned. In practice, however, a sloppy use of statics can lead to even fake news, when the concussions are drawn superficially, but positioned as if based on careful statistical analysis. Consider this claim: “The proportion of suicides in all deaths is highest among the people under 20 years with 25%, compared with 10% among 30-40 year olds, and less that 2% among over 70 year olds”. Conclusion (wrong): “So, the decision to commit a suicide decreases more and more with the age”. Can we agree with this claim? If we look at it closer, there are many flows in this claim. First, there are no absolute numbers, which makes it unknown how many actually died in every age group. As a result, the current proportion cannot be correct since the death numbers in each groups are different. Also, there are no reasons indicated for the other deaths (they may be due to traffic accidents, diseases, etc), which makes the picture distorted, as there may be a growing number of other reasons for death in older age groups. If such news are published in press, they look scientific, but the public should not be deceived. If we read this claim slowly, think of the context, and consider if this is possible at all, we can see that it cannot be correct, and does not allow to judge reliably about the behaviors of different age groups. More Traps for Media: Misinterpretations There are many of such false news. One very famous example originated from a study conducted by Denmark, universities, that investigated which students complete and which drop their studies. The drop rate was up to 40% over the first year, so it was important to explore the reasons for this. The research group discovered a surprising and rather confusing result. They found a negative correlation between the drop rates and the drinking habits of students. But it was not the conclusions that comes immediately to mind (that drinking habits lead to drop outs), but the opposite. The surprise was that the regularly drinking students dropped less! All world media shared these unbelievable news: the more you drink, the more successful you are in your studies! “Sober students are more likely to drop off” were the headings in many media. But could we really draw such a conclusion form this statistical study? No, we cannot. First of all, this cannot be a conclusion but a hypothesis, as there may be other variables interfering into this correlation. In other words, it is not that “X correlates with Y”, but “X correlates with Z (a third variable), which correlates with Y”, and other variables may be missing from the analysis. For example, social occasions may contribute to completing the studies. Maybe, it is the active social life that helps success in the studies (the students, who did well, and did not drop, did not fear the exam, probably because they socialized with others). Since this statistical study did not look deeper into the habits, we just do not know. As statistics professionals know, correlation does not indicate any causality. In other words, the most likely explanation may not be the truth. True reasons may be many. A simple answer is to check carefully before making claims. Traps of Statistics for Professional Science: In Significance Level and Data Openness However, even the correct process of interpreting the data can lead to wrong results that are seemingly based on correct statistics. If we look beyond popular media, there are still many underlying reasons (not only the fake news) why statistics can be “lying with the numbers”. It may happens, for example, if someone is trying to make sense of statistics - in any science, in biology, chemistry, economy etc. - without awareness of specific flaws that may be awaiting. One of the reasons of flawed results in science, especially in the past, is the way how we do science. It often dictates wrong conclusions. The current statistical rates of measuring the acceptability of science results started in 1925, with the British statistician Ronald Fisher offered a cup of tea with milk to his colleague, Muriel Bristol. Muriel refused this cup saying that Fisher poured tea first and milk second into her cup, while she likes it the other way round. She also claimed that she can see it at a glance which liquid was poured first. Fisher arrange a special experiment for her, to check how many times she could correctly make such a prediction. Fisher concluded that "Bristol divined correctly more than enough of those cups into which tea had been poured first to prove her case". But how many cups are enough? Since Fisher’s influential 125 books, the statistical significance was accepted at the rate of 5% for scientific results to prove “true”. In 1925, Fisher’s believed that 6-8 cups were “well enough” (starting from Fisher’s statistical book), and since then a significance rate of 5% has been accepted by science as “well enough” for many disciplines, and often continues till now. In practice, however, statistical significance does is not equal to a real life significance. If we have a significantly large size of sample, even the smallest effect can be calculated as a significant result! By now, enough evidence is collected by statistics that argue against a blind adoption of the 5% significance level (and this is still the rate to get published in medicine, for example!) reliable results cannot be obtained. In 1925 it was probably ok, but it cannot be accepted any more, although it still happens today. If someone tests a new drug against 5% significance level, it simply does not make sense, as the significance level alone does not tell us anything about the effect of the drug.. This is clear to all who know statistics and its behavior. This is where “bad science” comes from that has come into light in recent years. The answer is to have a significant difference, and do not accept low levels with 5% of proof. This is not any more acceptable and there is a lot of discussion around it nowadays. How to Avoid These Traps in Science and Business? Therefore, good science needs to have, first of all, to pay attention to the significance levels and the size of the sample group. Next, good science will also absolutely necessary analyze the difference, measuring the true effect size. Good science should check all the factors carefully, by testing the same correlation in random groups, the bigger the groups, the better the ground! At the same time, professional scientists cannot rely only on correlation. The problem with correlation is that is does not say anything, it does not prove any causality. This is why there is a need to establish experiments. A good reading here is the book “Designing experiment” Fisher, 1943. My message to students is do not be fooled by media or “poor” science who do not understand the dark side of statistics. Also, for professional scientists, it is important to stop use “null” hypothesis tests, or testing the opposite instead of testing the actual phenomena. Such “null” tests lead to a lot of confusion (like in patient statistics developed in 19th century, instead of using significance testing). But the main issue for science is the absolute necessity to publish the data (instead of a 5-page note about conclusions, which can be drawn incorrectly). Give the raw data, show it, tell how much and what was measured; or if not publish, demonstrate the data to experts, similar to the practice in referenced journals. This initiative is called “Open data initiative”, there still could be flawed data, but this openness about the simple will increase reliability of science results. Management of organizations should also be aware of these effects. Management needs more educations in order to use the statistics produced by consultants and own staff more effectively. This is especially evident for Marketing research. There was a big discussion in “Spiegel” magazine recently, and some professionals even claim that all marketing research is flowed since consultants are not educated in statistical methods. This discussion shows that deeper knowledge of statistical methods is needed for professional in all fields, journalists, politicians, even scientists. A wide society also need to be more demanding and create pressure to prove the grounds for conclusions based on statistics. Without a careful check of the utilized data samples, the data analysis process and interpretation, no reliable conclusions are possible, even from such a precise discipline as statistics. ================================================= Prof. Dr. Patrick Planing - a guest speaker from Stuttgart Hochschule für Technik teaching Statistics and Statistics Models for big data. His interested include business psychology, future thinking, predictions, strategy scenarios, and many other interesting topics related to data. Zinaida Grabovskaia, PhL - a lecturer and Head of Business Informatics Master’s Program at Metropolia University of Applied Sciences. Zinaida is interested in inviting the latest and most important topics to professional discussion with Metropolia Master’s students.

The editorial team will provide the content of the Masterminds blog before publication.
The editorial team started its work at the beginning of 2022.
Pia Koirikivi, chief editor in Masterminds blog, Pedagogical Specialist
Minna Kaihovirta, Manager of Dialog
Iira Lankinen, Principal Lecturer
Riikka Wallin, Publications Specialist
Zinaida Grabovskaia, Senior Lecturer
Salla Kivelä, Principal Lecturer
asiantuntija yamk business informatics Business Informatics Master’s Program CERN Bootcamp Construction Business hankinnat hankintastrategia hankintatoimi ilmastonmuutos Industrial Management Industrial Management Master’s program johtaminen koulutus kulttuurituotanto Marjatta Kelo master Master's Thesis masterminds Masterminds blog Master of Engineering Master’s degree Metropolia Metropolia AMK Metropolia Master's Metropolia UAS metropolia YAMK opinnäytetyö osaaminen service design Sharing economy sosiaali-ja terveysala sosiaaliala study trip Sustainability talotekniikka terveyden edistäminen terveydenhuolto työhyvinvointi ura yamk YAMK-tutkinto YAMK opinnäytetyö ylempi AMK ylempi ammattikorkeakoulututkinto Zinaida Grabovskaia
